
I’ve been building this site using npm and Jekyll, while deploying on CloudFront, for many years. It’s been just fast enough for me, but I’m always looking for ways to make things better. I’ve been skirting the line with a ‘perfect’ performance score for a long time. Lighthouse wasn’t giving me 100 across the board and that was bothering me. So, I decided to treat the site like I would any product: run a proper performance and quality audit, fix the issues, and iterate until Performance, Accessibility, SEO, and Best Practices all hit 100. Simple, right? Here’s how everything went.
Where things started
The stack was already in pretty good shape. As noted, I build static HTML and hashed CSS and JS for long-term caching, employ a service worker, and serve everything via a CDN (CloudFront). So the low-hanging fruit was already done. What was left were the kinds of issues that audits love to flag: render-blocking resources, images without dimensions or loading hints, contrast and link styling for accessibility, and a few SEO and security details. I didn’t record exact before scores but I have made other attempts at these sorts of improvements in the past, and can confidently say scores have hovered around 80-90 for a long time. If you’re in the same boat, run Lighthouse and use that as your baseline. My goal was to fix every failing or warning audit until all four categories showed 100.
Performance: critical path and Core Web Vitals
I started with performance because it touches so much of the site experience. Performance is also my passion. I love the other areas we’ll cover as well (accessibility and SEO) but I’ve spent a lot of time focused on web performance over the years, so this is one particular area I felt I needed to get right.
CSS, critical path, and third-party scripts
The single biggest fix across the site was the main stylesheet. I had a malformed link tag in my site <head> that tried to be both a preload and a stylesheet. I assume this was an attempt at an old performance tactic or a misunderstood application. I split the style reference into a proper <link rel="preload" as="style"> followed by <link rel="stylesheet">, which lets the browser prioritize CSS correctly. This directly improved First Contentful Paint (FCP) and Largest Contentful Paint (LCP) considerably.
Furthermore, I still leveraged Google Analytics which was declared in the <head> and blocked parsing while it was loading. This is a serious single point of failure (SPOF) anti-pattern. Even Google is fallable, after all! I moved this external script reference to the footer and kept it async so it no longer affected Time to Interactive (TTI) or Total Blocking Time (TBT). I also added dns-prefetch and preconnect for the the Google Analytics origin so that when those requests run, they start faster.
Images and fonts
Feature images and post cards were missing consistent width, height, loading, and fetchpriority. I added dimensions everywhere to avoid Cumulative Layout Shift (CLS), loading="lazy" for below-the-fold images, and fetchpriority="high" only for the main LCP candidate. I also added image sizes so that when I add a responsive image pipeline later, the groundwork is already there.
I was also preloading several font variants from Google Fonts, again as a third-party resource. I decided to host the fonts first-party and also migrated to more accessible font faces (more on that later). I kept preload only for the two fonts used above the fold (Lexend and Atkinson Hyperlegible Regular) and switched non-critical variants (for example, italics) to font-display: optional to reduce layout shift and avoid unnecessary network cost.
Service worker load and caching
The service worker was registering on window.load, which fires late. This is not great when we want to leverage the benefits the service worker is providing on subsequent loads. I moved registration into the <head> with a small inline script so the SW activates sooner and can serve cached assets on repeat visits.
I also tuned the Workbox config for SW caching so the worker precaches only critical assets (CSS, JS, fonts) and uses runtime caching for HTML and images with sensible TTLs. I’d previously been caching everything including all blog entry and header images. That was too aggressive and caused our SW cache to be too large, and while offline viewing of this site is neat, it’s not worth the trade-off in performance to treat like a full PWA in real-world use.
After these changes, LCP, FCP, CLS, and TBT all landed in the “good” range and the Performance score in Lighthouse reached 100. This felt like a major milestone to me and it definitely feels good to see that green Performance score. Off to a great start!
Accessibility: contrast, links, and structure
Improving readability
I next ran the Lighthouse accessibility audit and fixed every failure and warning. The main problematic areas were color contrast, link affordance, and heading order. I followed some best practice recommendations like those from a11ty Collective. As noted earlier, I also adopted fonts designed for improved readability: Lexend by Google for body text and Atkinson Hyperlegible by The Braille Institute for headers. My base text and link colors compared with their background didn’t meet WCAG AA. I lightened body text and links (lighten(@text-color, 10–15) and lighten(@link-color, 15)) so they meet the 4.5:1 requirement. Buttons that had dark text on the accent color were switched to white (#ffffff) so they pass as well.
Proper links and headers
Links also had to be more distinguishable beyond their color. I ensured links were underlined using text-underline-offset, and a visible focus outline so keyboard users and anyone who doesn’t rely on color alone can see them clearly. Every interactive element received a visible focus style (outline: 2px solid ... with an offset) so keyboard navigation is obvious. The homepage headers also jumped from h1 to h3, which is a bad practice for screen readers and SEO alike. I fixed the hierarchy so it goes h1 (site name) to h2 (tagline) to h3 (post titles), with no skipped levels. The same idea was applied on other templates across the site where section structure was off.
After these passes, the Accessibility score hit 100. Onward!
SEO and best practices
At this stage, SEO and Best Practices were mostly cleanup of past mistakes or simple oversights. The items that were flagged in Lighthouse for SEO were generally pretty straight forward to address. They are also designed to follow security and privacy best practices.
Security and privacy
For external links from blog posts or across various templates, I ensured proper use of rel="noopener noreferrer" and fixed any protocol-relative URLs to https://. noreferrer and noopener are used on target="_blank" links so the newly opened page can’t access your page via window.opener for security purposes, and the referrer isn’t sent for privacy.
Alt text and images
Next, I replaced generic link text (for example, “Read more”) with descriptive text or aria-label where needed. Then I ensured that images had descriptive alt text everywhere, and for any image that had been hosted externally and was flaky, I moved it first-party under assets/images/ and pointed the markup at the local file.
Meta data optimization
I’d already established standard meta descriptions, canonical URLs, and Open Graph tags. I confirmed every page had a proper description and that schema (BlogPosting, WebPage) is correct. The same layouts also use microformats 2 (mf2) class names so social parsers can interpret posts and pages. Posts and cards use h-entry with p-name, u-url, e-content, dt-published, p-author h-card, and p-category on tags; older schema and mf2 live on the same elements without duplicate markup.
With all those improvements in place, SEO and Best Practices both reached 100. Very marketable!
How I measure, iterate, and maintain
I used Lighthouse in Chrome DevTools–and sometimes SiteSpeed.io loaded via docker–on the live site and on local builds. I ran Lighthouse in incognito with extensions disabled to avoid noise. For each category I fixed the listed issues, rebuilt, redeployed or refreshed, and re-ran the audit until there were no more failures or warnings. I didn’t chase a specific number so much as “zero failing audits” or digging into specific warnings, and the 100-passing scores followed.
I kept Core Web Vitals targets in mind to achieve a “good” score: LCP under 2.5s, CLS under 0.1, INP under 200 ms. I tried to follow current standards as of this writing, where the primary metrics of CWV: LCP, FID, and CLS, were originally announced in May 2020, and INP replaced FID in March 2024. I also documented the patterns in performance, accessibility, and SEO for myself to refer to so future changes (hopefully) stay compliant.
Quality gates and performance budgets
As a small bonus: I also added a small script that runs after build (npm run build:size) to report CSS and JS size and to fail the build if limits (100 KB CSS, 50 KB JS) are exceeded. These budgets ensure I stick to “Best Practices” and try to avoid regressions as I add more content or make additional changes. This sort of check can be added as a quality gate in build pipelines so that when a build:size fails, the build fails and alerts on the condition; this is nice because it forces the standards for lower package weight to be followed, maintaining performance in the long run. Similarly, one could add steps that run Lighthouse/SiteSpeed.io checks and fail on any resulting CWV that isn’t passing.
What’s next
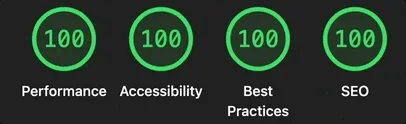
The site is in a good place: all four Lighthouse categories at 100, Core Web Vitals in the green, and documented patterns for performance, accessibility, and SEO. Optional next steps I’ve left for later include an image pipeline (responsive srcset, WebP/AVIF), critical CSS extraction, font subsetting, and configuring CloudFront to send immutable for hashed assets. For a small static site, the current setup is enough to keep scores at 100 as long as new content and features follow the same rules.
If you’re working on a personal or small project site, the same approach works: run Lighthouse, fix the audits it reports, then encode those fixes in your templates and styles so every new page stays fast, accessible, and SEO-friendly by default.